_PREVIEW_
3.11 @TOKYO Tweets Mapping
Intro.
この研究では帰宅困難者という観点から、2011年3月11日の東京山の手での人々の移動について、Twitterを用いて把握しようというものです。
Mapping自体が目的ではなく,tweetからどれだけの情報が得られるかということの方が大事です.
In this research, I try to find the situation of people who moved on March 11th 2011 in Tokyo.
It is more important than Mapping in itself that find how useful tweets is in civil engineering.
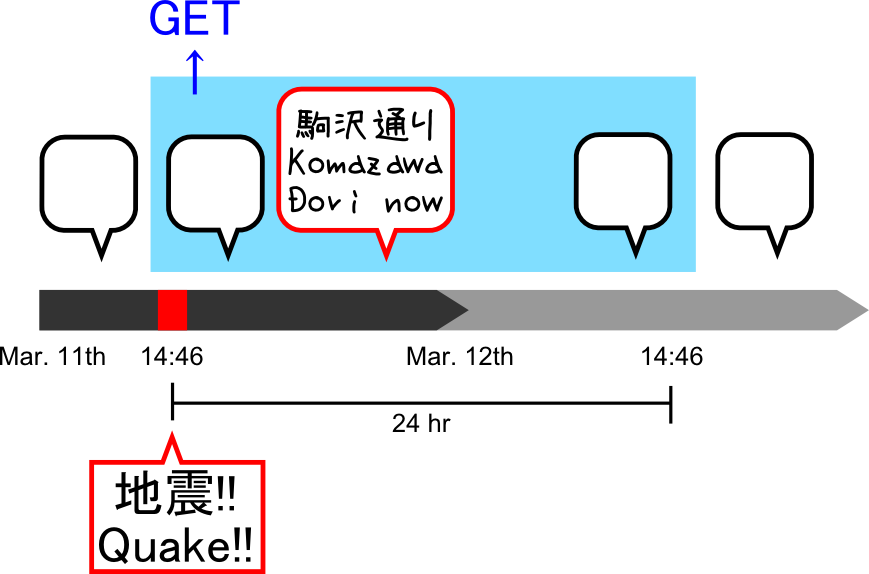
Target Tweets
2011年3月11日14時46分から24時間の間に,
● 駒沢通り [K - K]
● 目黒通り [M - M]
● 六本木通り [R- R]
の3路の名前を含むtweetをしたユーザーの24時間のtweetを分析の対象としています.
Tweets from 2:46pm March 11th 2011 to 2:46pm 12th, including following words.
● 駒沢通り (Komazawa dori ave.) [K - K]
● 目黒通り (Meguro dori ave.) [M - M]
● 六本木通り (Roppongi dori ave.) [R- R]
And 24 hours tweets posted by users who tweeted including the streets names once or more in 24 hours.
Geotaging
できるだけ多くのtweet位置を明らかにするため、次のような基準で作業をしました。
1. もともと位置情報があればそれを採用
2. 写真が添付されていれば、その撮影場所を特定
3. 地名が含まれていれば、そこを採用
4. 手がかりの無い場合、前後のtweet位置と時刻から場所を推測
いずれの場合も、前後関係から不自然な位置の場合は場所をずらしたり、特定不可能なことがありました。
(ビルに囲まれているなど測定誤差がある。foursqusreなどをつかっていると、施設に一か所の位置が指定されているものがあり、その場合はずれてしまう。)
To identify the places tweets posted as many as possible, I geotaged tweets, turned to following criteria.
1. With Geotag : Take default location.
2. With a Photograph : Identify the place.
3. With a Place Name : Take the palce.
4. Without keys : Guess where and clue other tweets.
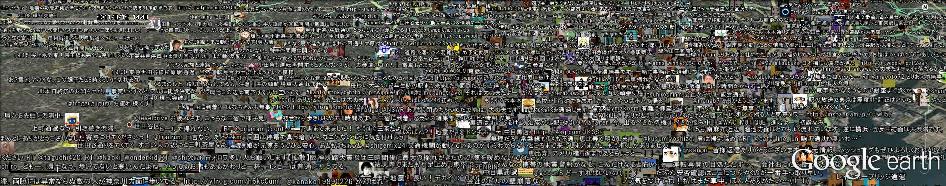
Mapping Simply
Points
特定された全てのtweet位置を点で表しています.
I plotted points on every tweets identified where and when users posted.
Strings
特定されたtweet位置を線で結んだもので,分かった範囲での各々の移動経路を示しています.
I drew lines linking identified points every tweet posted at. This expresses users' trip routes.
Grids
位置の特定できたユーザーの数をログスケールの色のグリッドで表したものです. グリッドサイズは500[m]と250[m]で,上野駅,新小岩駅,川崎駅,登戸駅で囲まれる矩形範囲で集計しました.
The number of users in 500[m] and 250[m] grids. The more bright colors are, the more users were at the places. The color brightness is on the logarithmic scale. I counted just users on the rectangular including Ueno, Shin-Koiwa, Kawasaki and Noborito station.
位置の特定できたtweetの数を1時間ごとにログスケールの色のグリッドで表したものです.
The number of identified tweets per an hour.
混雑がどんな具合かをポジティブとネガティブで表現したものです.
Positive or Negative about how is crowded.
Contact
Other Contact
This quata owner Hitoshi HIIRAGI's Twitter
@hiiragi1104
This site owner Hitoshi TAKAYANAGI's Facebook
Hitoshi Takayanagi